FINANCIAL
REVIEW
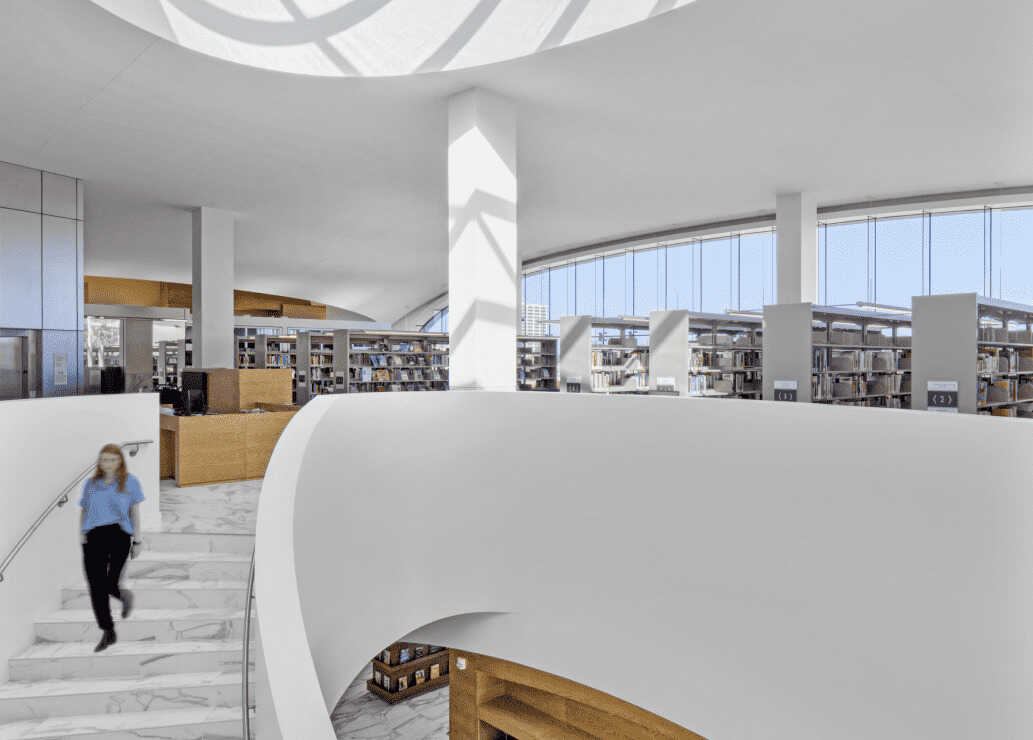
USA Donald Dungan Library, California / Data & Flooring ConCore 1250, 1500 & 2500
Financial Summary
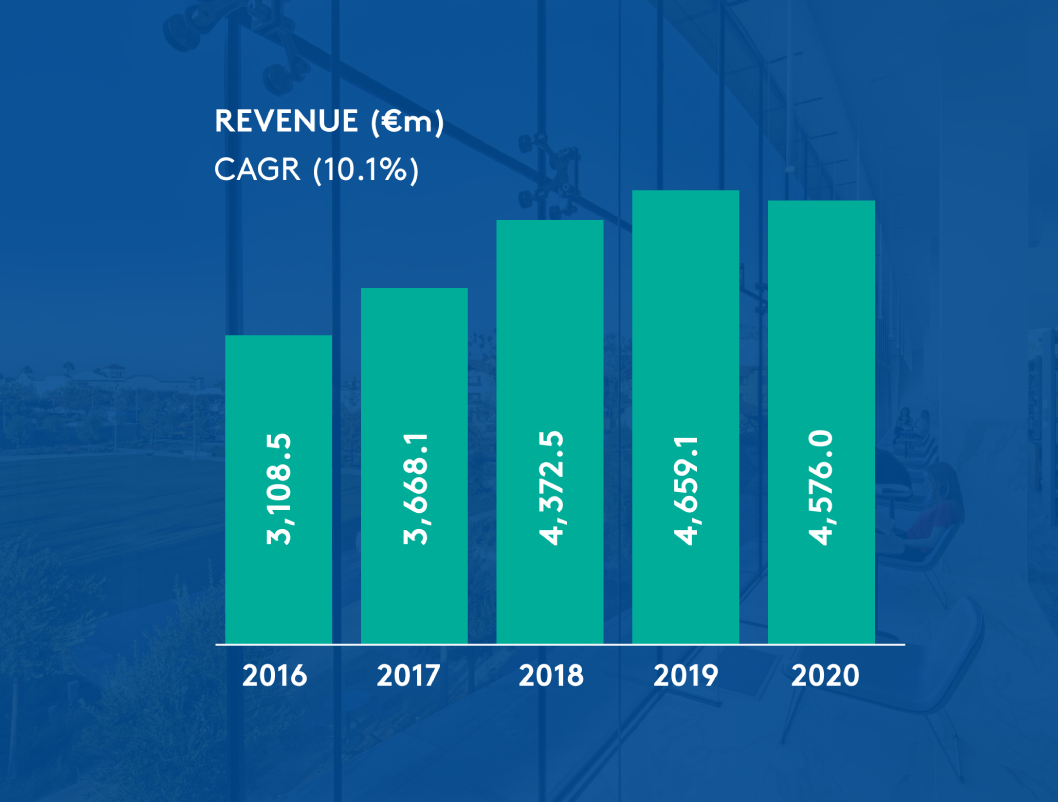
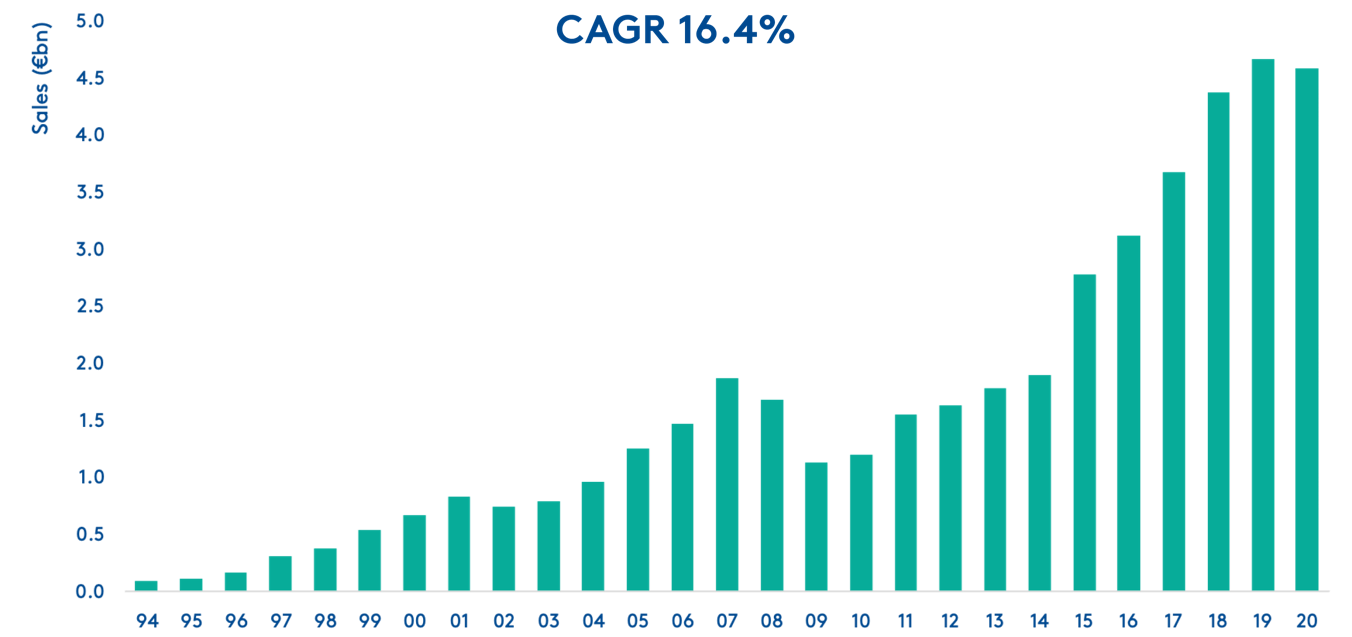
REVENUE
REVENUE
€4.6bn
-2%
2019: €4.7bn
EBITDA ¹
€596.5m
+3%
2019: €579.8m
TRADING PROFIT ²
€508.2m
+2%
2019: €497.1m
TRADING MARGIN
11.1%
+40bps
2019: 10.7%
PROFIT AFTER TAX
€384.8m
+2%
2019: €377.8m
EPS
206.2c
+1%
2019: 204.6c
1. Earnings before finance costs, income taxes, depreciation, amortisation and the impact of IFRS 16
2 Operating profit before amortisation of intangibles
3 Trading profit divided by total revenue
Financial Review
The Financial Review provides an overview of the Group’s financial performance for the year ended 31 December 2020 and of the Group’s financial position at that date.
Overview of results
Group revenue decreased by 2% to €4.6bn (2019: €4.7bn) and trading profit increased by 2% to €508.2m (2019: €497.1m) with an increase of 40 basis points in the Group’s trading profit margin to 11.1% (2019: 10.7%). Basic EPS for the year was 206.2 cent (2019: 204.6 cent), representing an increase of 1%.
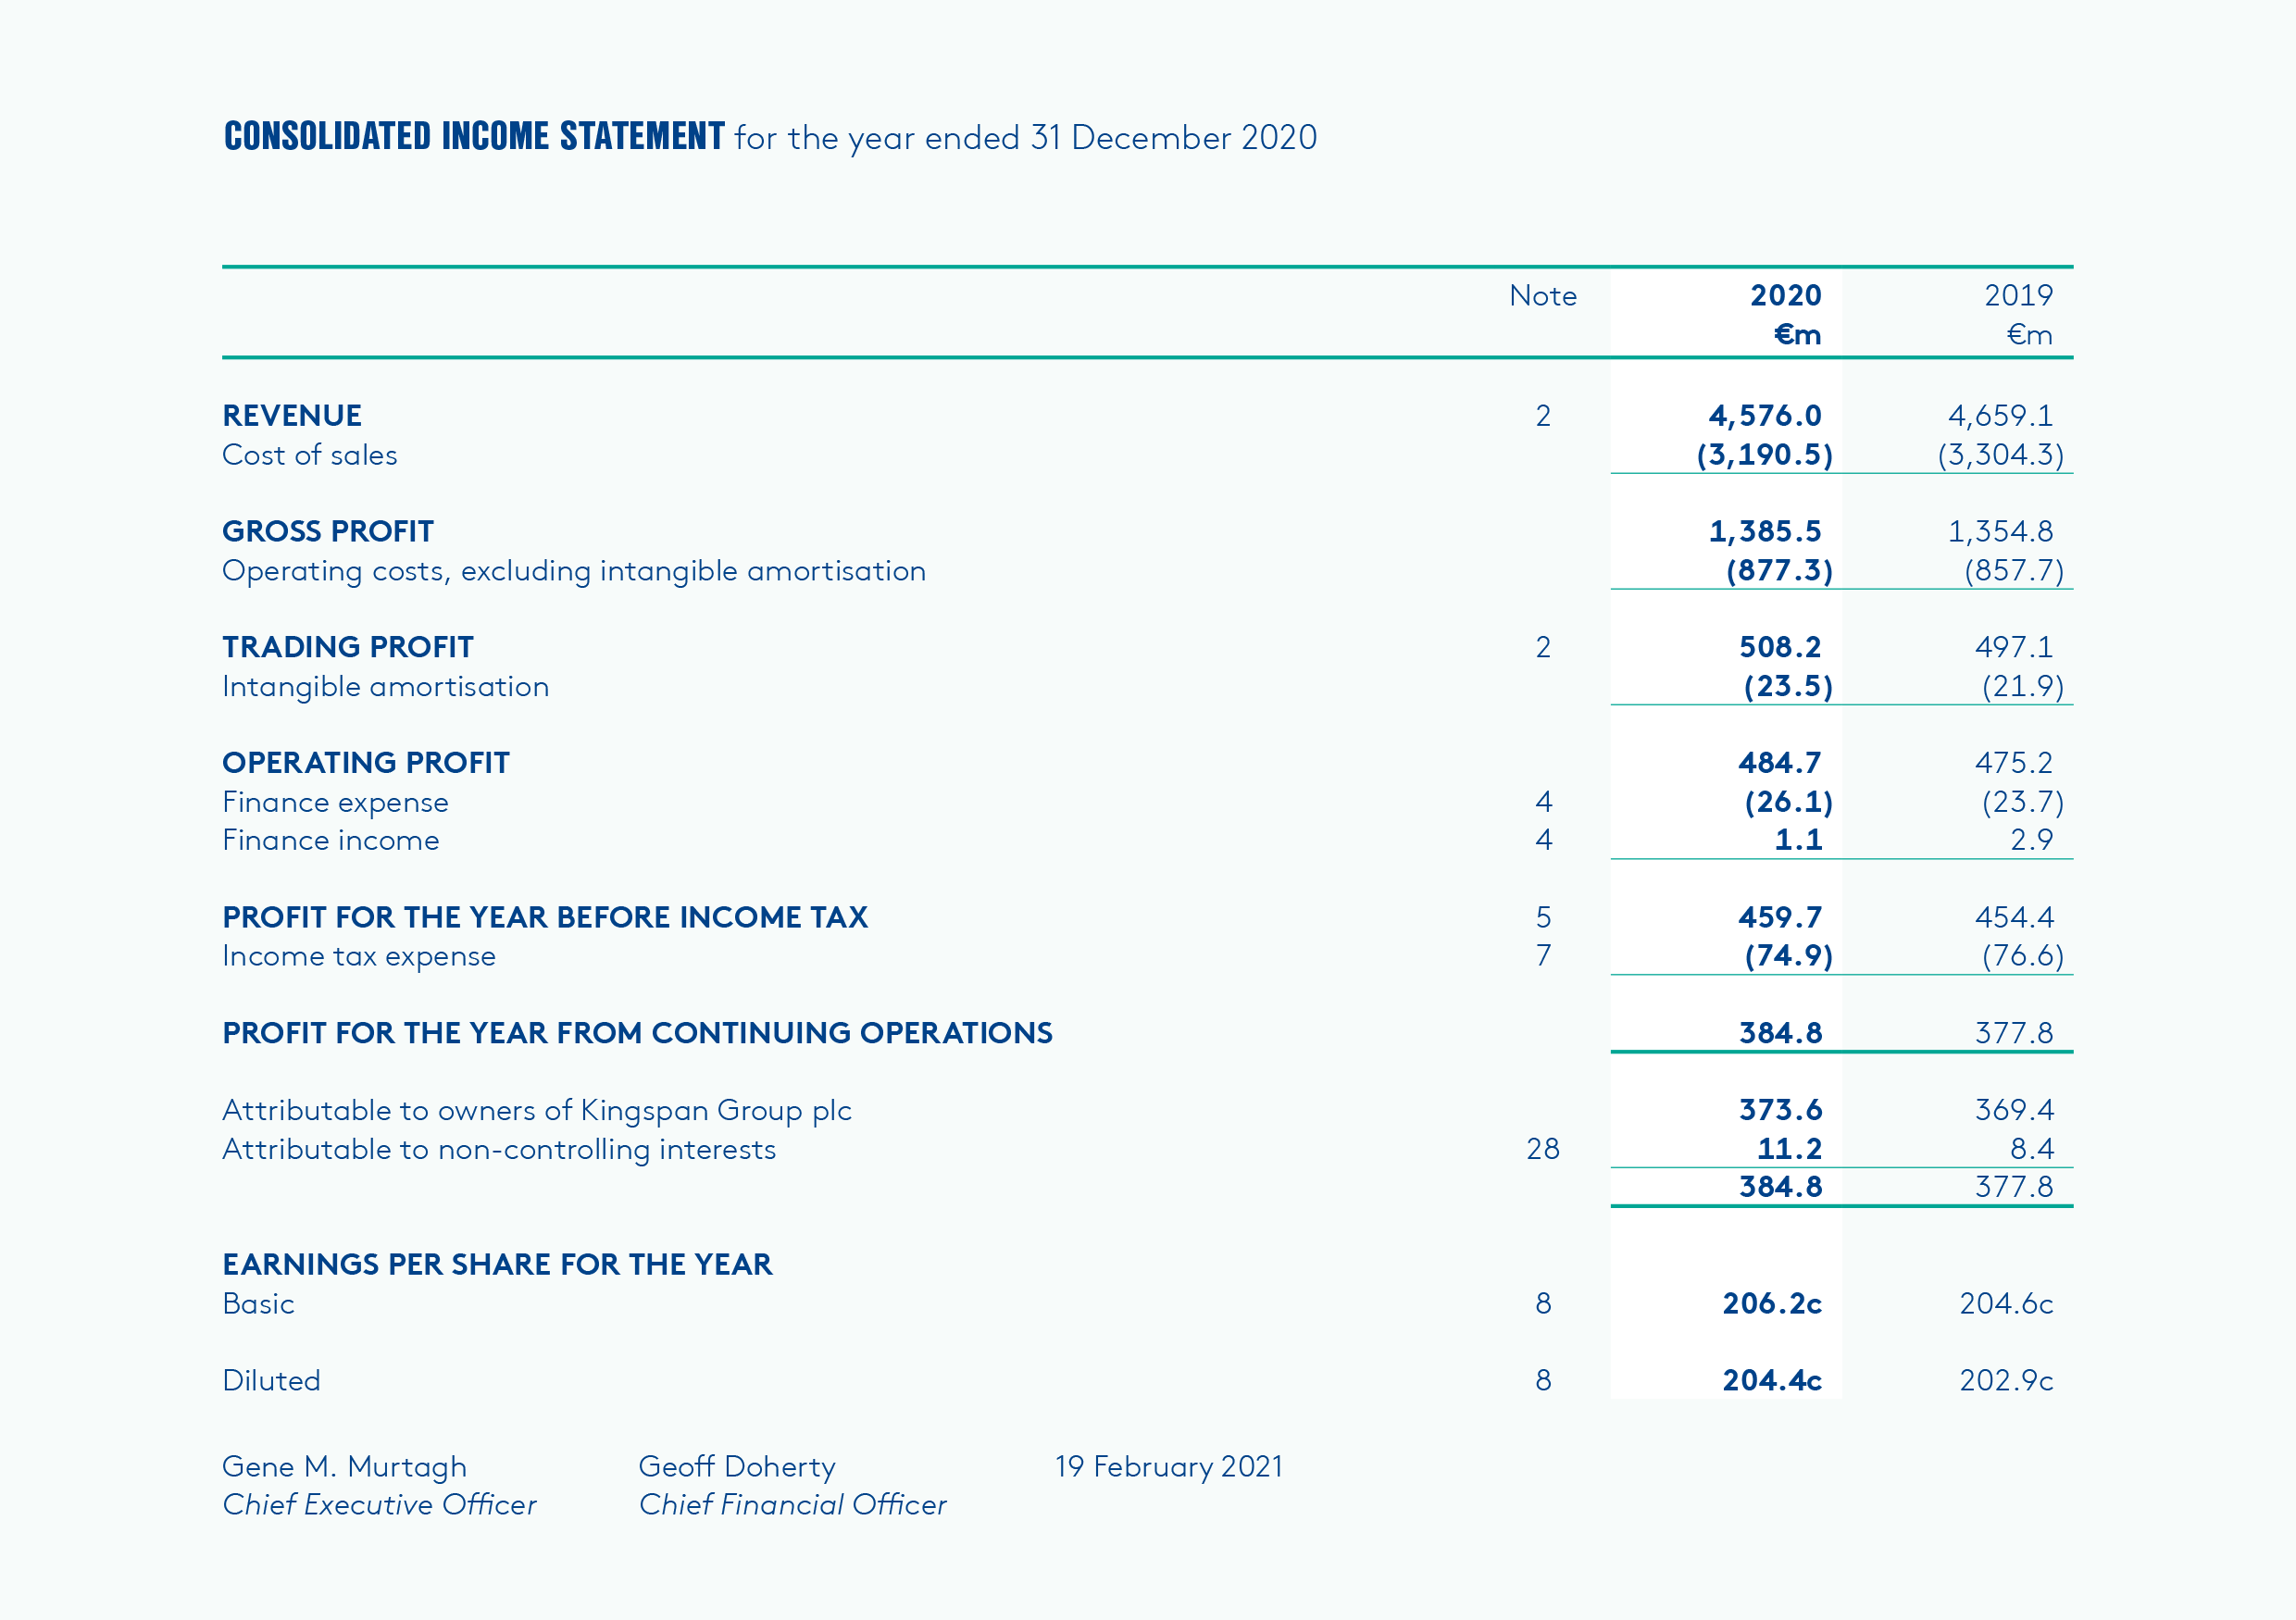
Income statement
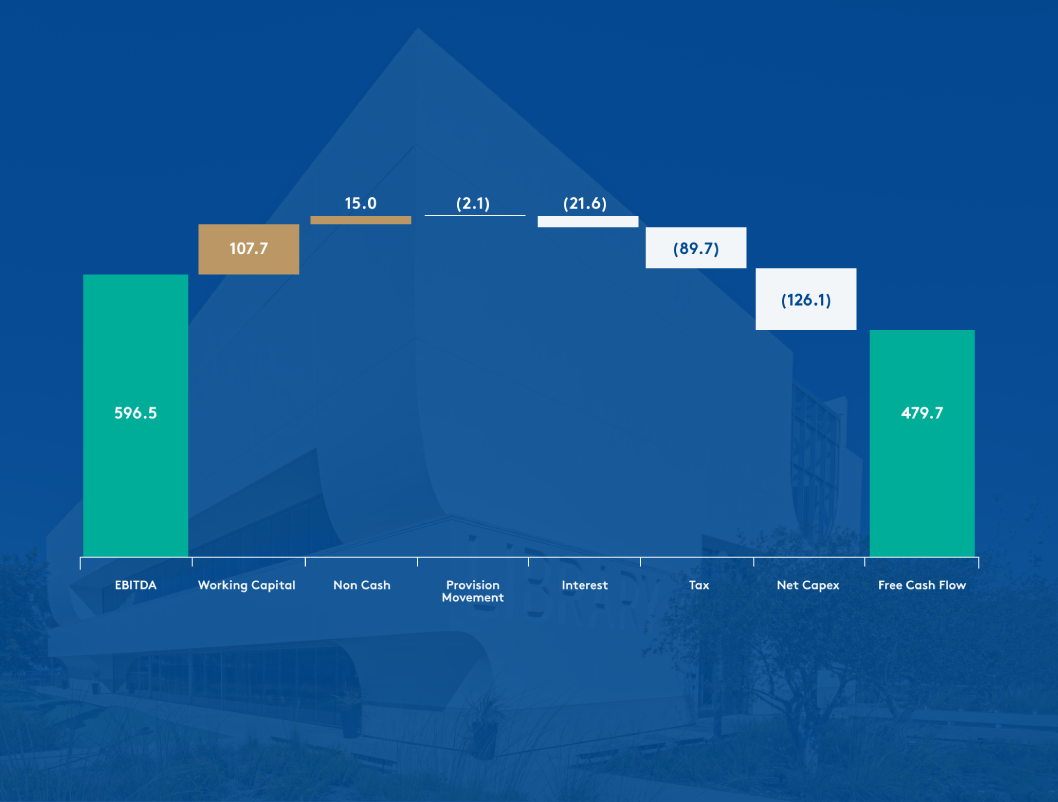
Free Cash flow in €M
Strong free cash flow
Free cashflow is an important indicator and it reflects the amount of internally generated capital available for re-investment in the business or for distribution to shareholders.
Working capital at year end was €450.8m (2019: €582.8m) and represents 8.8% (2019: 11.9%) of annualised sales based on fourth quarter sales. This metric is closely managed and monitored throughout the year and is subject to a certain amount of seasonal variability associated with trading patterns and the timing of significant purchases of steel and chemicals. Working capital levels in the business were unusually low for much of the second half of the year with reduced inventory levels in particular as our inbound supply chain continued to ramp up from subdued production earlier in the year. The working capital % is expected to increase in the first half of 2021 reflecting more normal inventory levels as well as inflation of some key inputs.
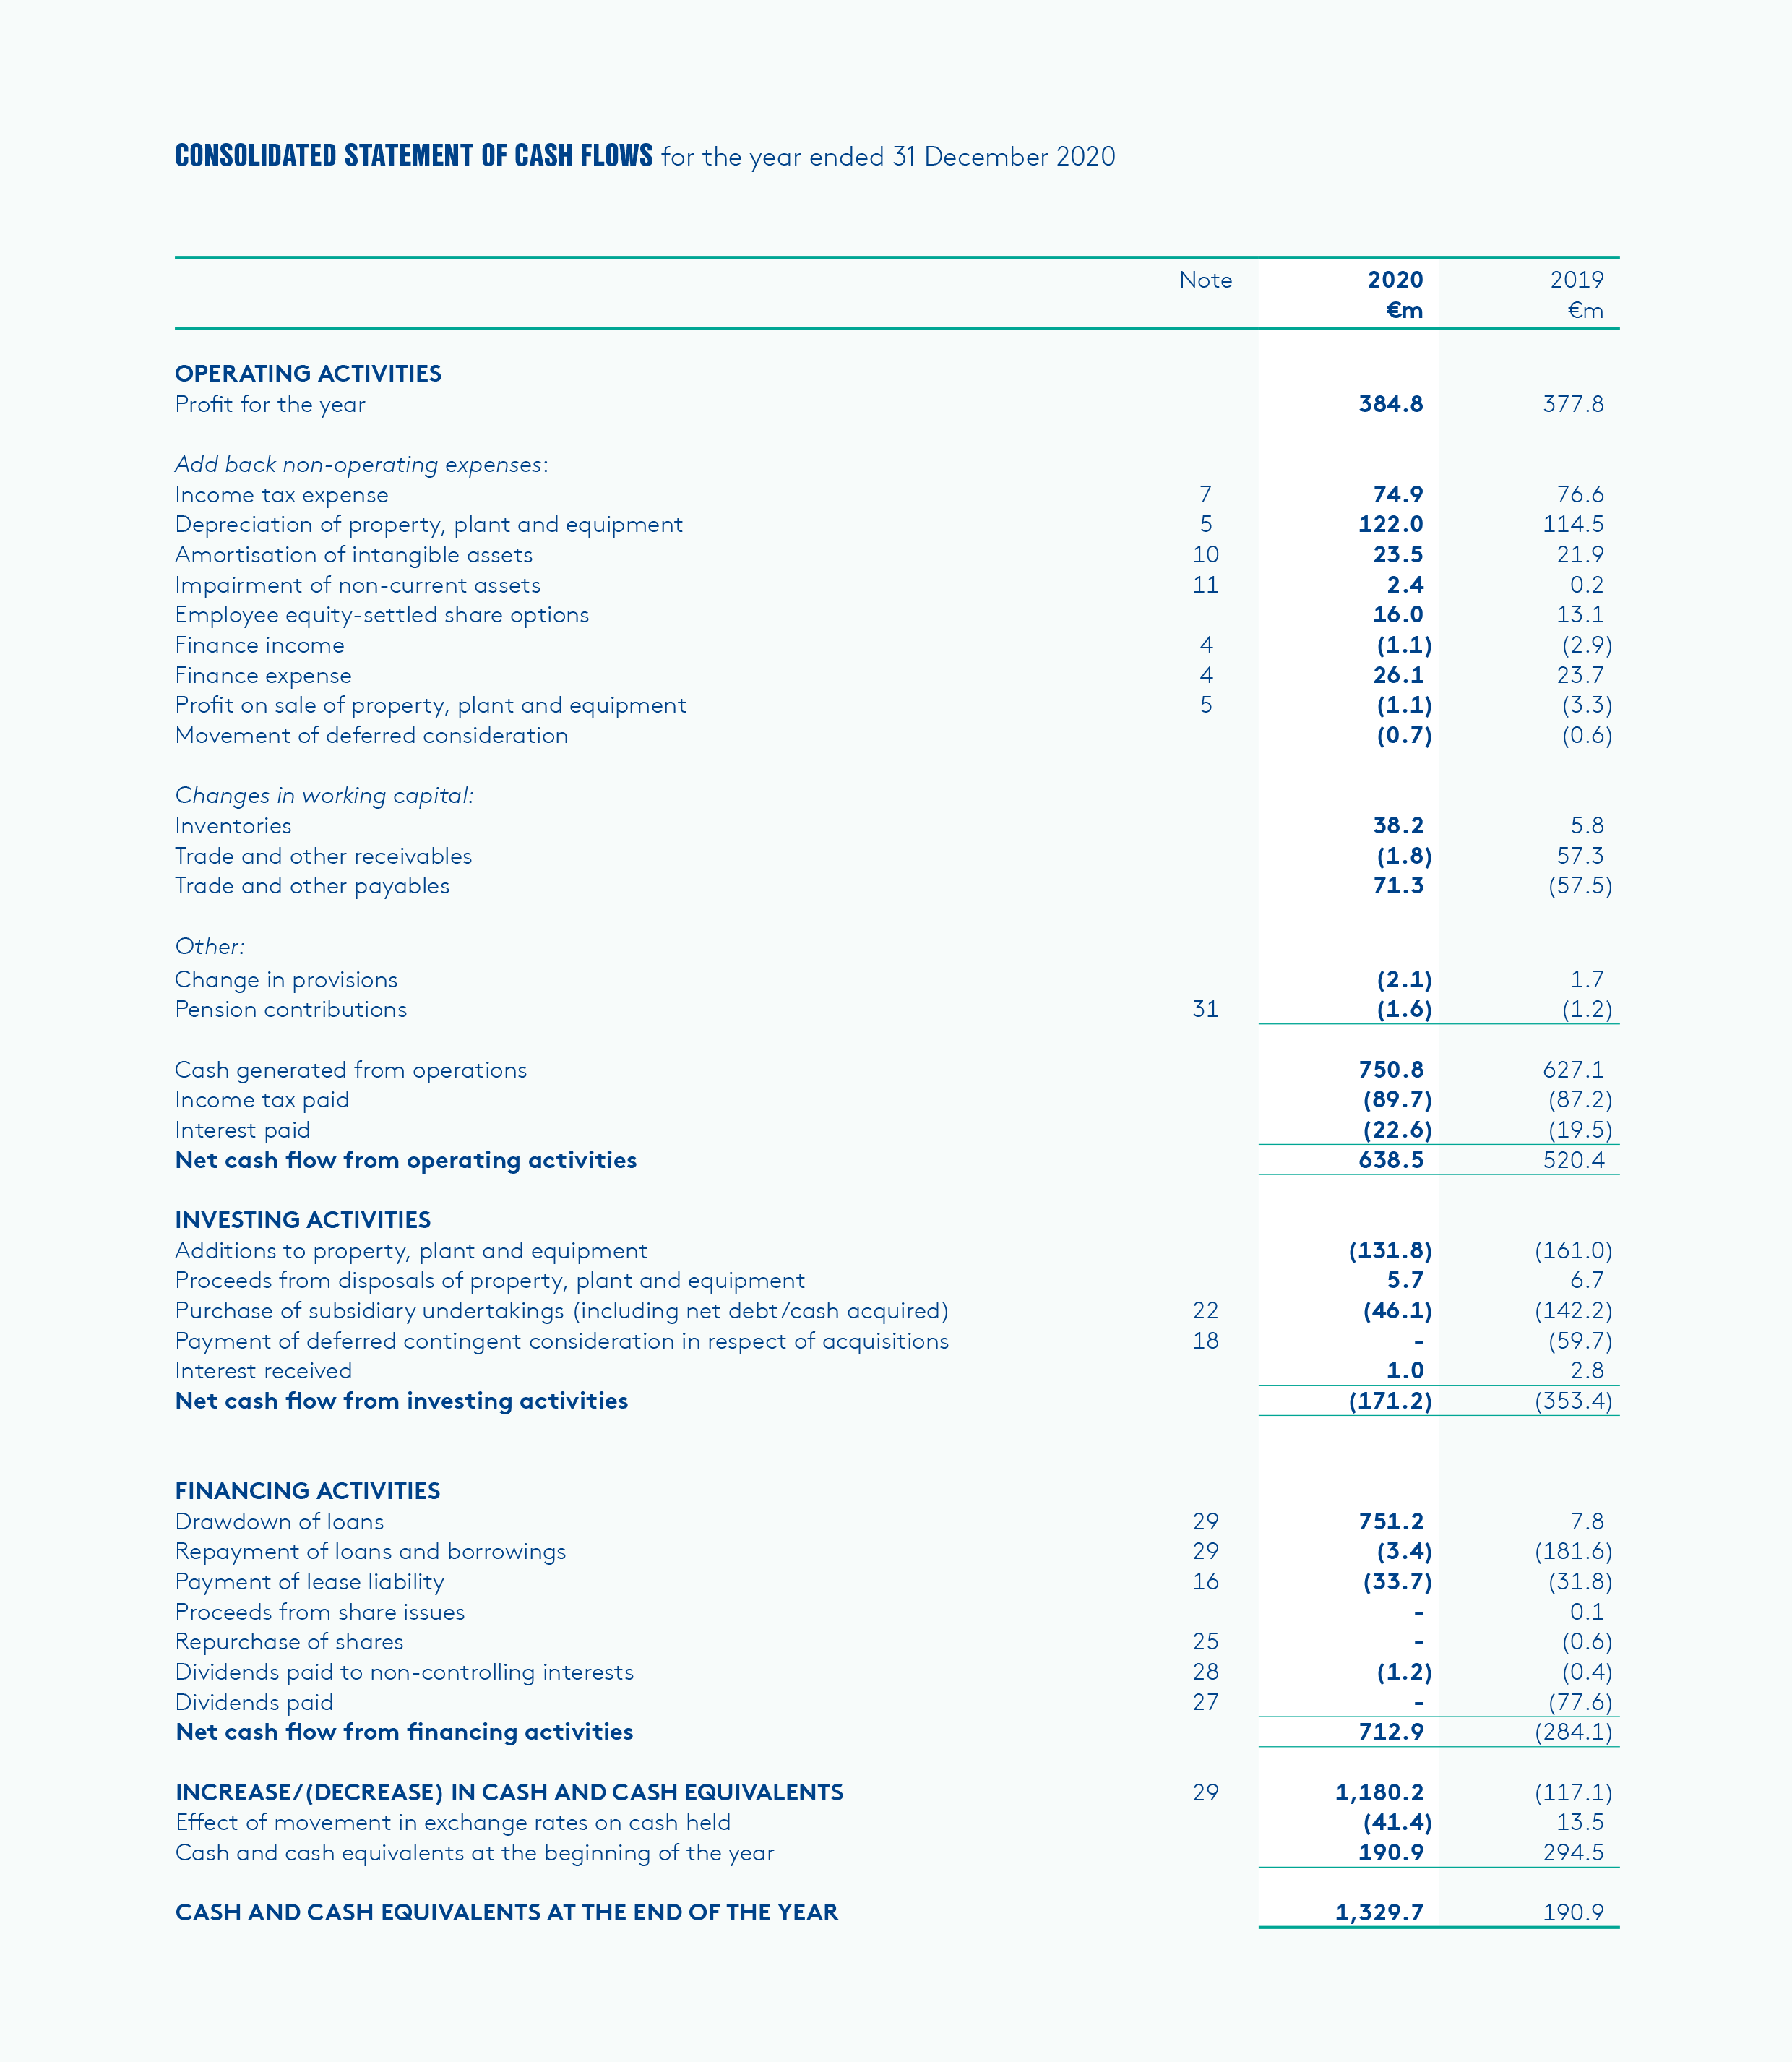
Statement of cash flows
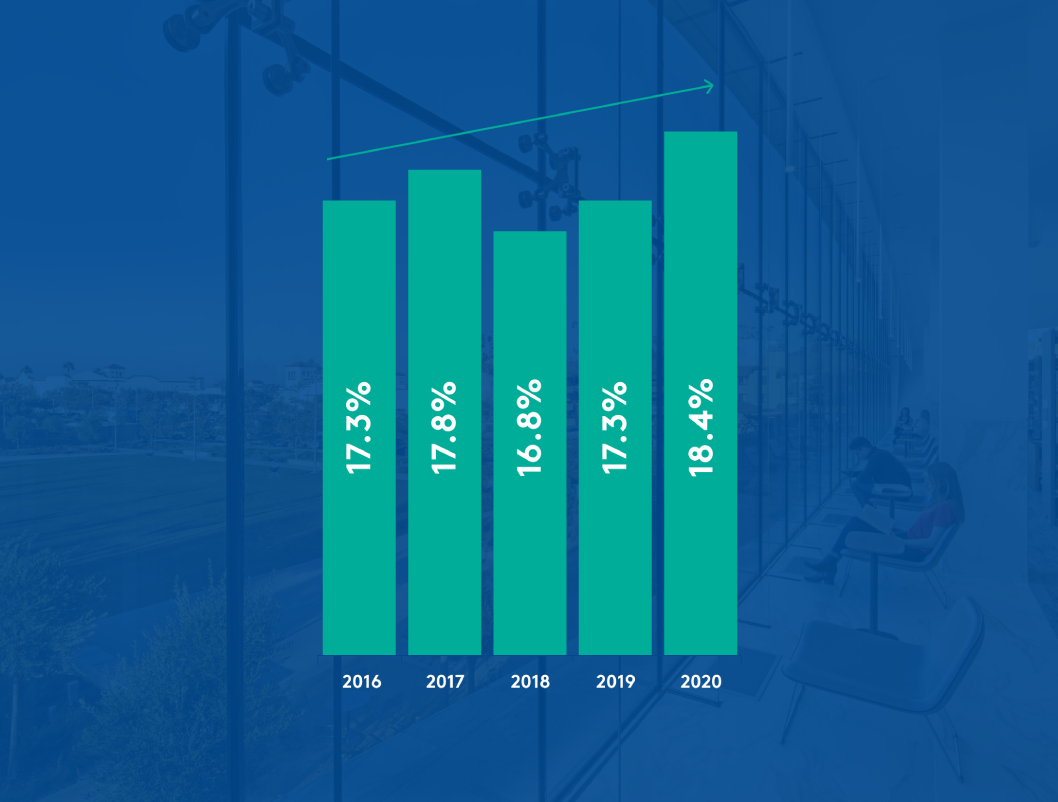
Strong ROCE
Return on capital employed, calculated as operating profit divided by total equity plus net debt, was 18.4% in 2020 (2019: 17.3%). The creation of shareholder value through the delivery of long term returns well in excess of the Group’s cost of capital is a core principle of Kingspan’s financial strategy. The increase in profitability together with the deployment of further capital has enhanced returns on capital during the year.
Balance sheet

Progress so far
Building Better

Chief Executive Officer’s Statement
The need for action on climate change is gaining increasing traction with policymakers worldwide. Kingspan’s proposition and our Planet Passionate programme are aligned fully with this urgent agenda.
Read More
Chairman’s Statement
Few could have foreseen, when I wrote my Chairman’s Statement last year, the global pandemic that would take hold and define the year that was 2020.
Read More
Business Model & Strategy
Our business model is to continue our relentless development of innovative and proprietary products which enable low carbon and healthy buildings – globally.
Read More